
 Tiếng Việt
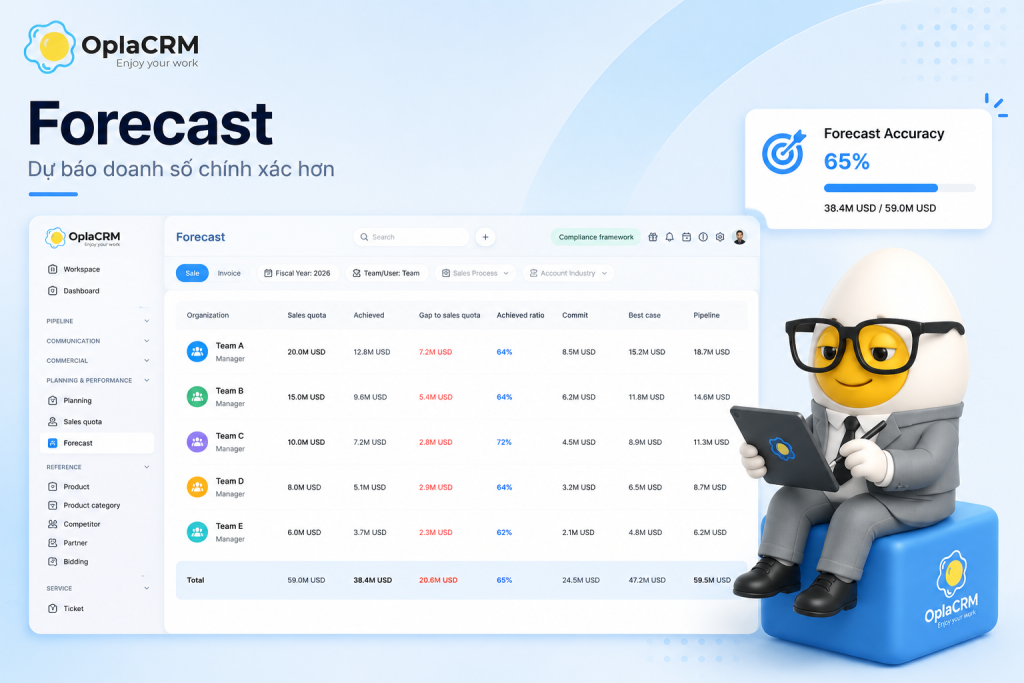
79%
Forrester Research,2026
31%+
XANT Labs – 270,912 deals analyzed
80%+
RevPartners,2026
7%
XANT Labs via Prospeo,2026
- Sales Forecast is not guesswork – it reads pipeline signals across 3 confidence levels:Commit,Best Case,and Pipeline. 79% of sales orgs miss their forecast by more than 10% every quarter – not because reps underperform,but because the system is measuring the wrong signals.
- Forecast only means something when placed alongside Sales Quota(the assigned target) and Achieved(actual closed revenue). Without all three in one view,the numbers have no decision-making value.
- In OplaCRM,Forecast appears on both the daily Dashboardand the detailed Forecast page by org chart– CEO,Sales Director,and reps see the same real-time data with no manual aggregation needed.
- Pipeline Coverage Ratio– pipeline divided by remaining quota – is the earliest warning signal available,and the one most often ignored until it is too late to act.
What is Sales Forecast?
A sales forecast estimates how much revenue a sales team will close within a specific period,based on current pipeline data and each rep’s confidence level across open opportunities.
Unlike a sales target – a number set by leadership before the period begins – a forecast is built bottom-up from what is actually happening in the pipeline right now: which deals are at which stage, how customers are responding, and where reps are placing their confidence. That is why a forecast is not static. It changes every time new data comes in.
– OplaCRM, Revenue Operations perspective
In B2B – particularly manufacturing, logistics, construction, and chemicals – deals typically run 3 to 12 months, involve multiple decision-makers, and carry enough individual value to move an entire quarter. A missed forecast is not just a wrong number. It is a wrong hiring decision, a wrong inventory plan, and a wrong board report.
Forecast, Quota, and Achieved – Three Numbers That Cannot Live Apart
These three concepts are frequently confused with each other – or tracked in three separate places. When that happens, no one sees the full picture at the same time.
| Concept | In OplaCRM | What it means | Does it change? | Used for |
|---|---|---|---|---|
| Sales Quota Target | “Quota” column | The number assigned from leadership down to each rep, team, and region | Fixed per fiscal year | Assigning KPIs, evaluating end-of-period performance |
| Achieved Actual | “Achieved” column | Real revenue from opportunities marked Close Won | Updates when a deal closes | Measuring actual results, calculating attainment |
| Gap to Quota Remaining | “Gap to quota” column | The difference between Quota and Achieved – how much still needs to close | Updates as Achieved changes | Knowing how far from the finish line |
| Achieved Ratio Attainment | “Ratio” column | Achieved as a percentage of Quota – red means below target, green means above | Updates as Achieved changes | Comparing performance across reps and teams |
| Forecast Projection | Commit + Best Case + Pipeline | Forward-looking view of pipeline across three confidence levels | Updates in real time as deals change | Making decisions before the quarter ends |
Commit, Best Case, and Pipeline – What Each Level Actually Means
These are the three confidence levels within OplaCRM’s Forecast. They are not three separate groups of deals – they are three ways of reading the same pipeline,each reflecting a different degree of certainty.
Forecast in OplaCRM – Two Views for Two Roles
OplaCRM does not bury Forecast in a separate reporting page. Forecast appears in two places – each serving a different role in the organization.
Dashboard – The Daily View (Sales Rep and Sales Manager)
When anyone opens OplaCRM,the right side of the Dashboard shows the Forecast widget immediately:three rows – Commit,Best Case,Pipeline– each showing deal count and total value. Reps see their own numbers. Managers see their team’s. No extra navigation required.
The same Dashboard also shows Quota Attainment (percentage of quota achieved), Win Rate (close won ratio), Pipeline by Stage (deal distribution across stages), and Activity per rep (calls, emails, meetings). Everything on one screen, at the same moment – not a Friday report.
Forecast Page – The Strategic View (Sales Director and CEO)
The Forecast page displays data following the company org chart: Company – Region – Manager – Rep. Every row carries seven columns: Quota, Achieved, Gap to Quota, Ratio, Commit, Best Case, Pipeline.
Red – Still short of quota
Green – Quota exceeded
A Sales Director opens this page and immediately sees that the Northern Region is at 9.6% attainment while the Southern Region is at 3.6% – the same quota, completely different performance. No questions needed. No report to wait for. Decisions can happen immediately.
Available filters: Fiscal Year, Team, User, Sales Process, Account Industry – enabling drill-down to any data cut needed.
Pipeline Coverage Ratio – The Earliest Warning Signal Available
This is the number many Sales Directors overlook until it is already too late to recover. Pipeline Coverage Ratio answers one question: with the pipeline currently in place, is there enough raw material to hit the remaining quota?
Coverage = 12M / 5M = 2.4x
In OplaCRM, this number displays directly on the Dashboard with the label “Pipeline Coverage – Pipeline / Remaining quota.”
| Coverage Ratio | What it means | Action required |
|---|---|---|
| Below 2x | Even if every Best Case deal closes, quota will not be reached | Add deals to the pipeline immediately. Review quota with leadership |
| 2x to 3x | Sufficient if deal slippage stays low, but the buffer is thin | Monitor Best Case deals closely. Work to move more into Commit |
| Above 3x | Healthy buffer – enough room for deals to slip without missing quota | Focus on deal quality, not deal volume |
Why Forecasts Still Miss Even With a CRM
Not “what is a forecast” – but “why is my forecast still off by 30% even though we have a CRM?” Three root causes.
1 – Deals in the CRM are not updated after each call
A rep finishes a customer meeting and the deal stays in its previous stage. Commit and Best Case do not change. With a B2B cycle running 6 to 12 months, one month without updates means the Forecast reflects last month’s reality,not today’s. According to XANT Labs analysis of 270,912 deals totaling $18.1B, 47% of deals missed their forecast by more than half – and the root cause was almost always data quality, not rep capability.
2 – Stage does not equal momentum
A deal sitting in “Negotiation” since 45 days ago, with no customer email response in three weeks, remains in Best Case because no one has moved it. This is exactly why Win Probability in OplaCRM matters – it reads actual engagement signals from real interactions, not just a static stage label. A deal with declining Win Probability is a signal to review, even if the stage has not changed.
3 – Quota and Forecast live in two different places
Quota sits in a manager’s email. Forecast sits in the CRM. Actuals sit in accounting. When these three numbers are not on the same screen,no one knows what the real gap is – until the end of the quarter,when there is no time left to close it. Forrester Research found that 79% of sales organizations miss their forecast by more than 10% – and the root cause is usually data spread across disconnected systems.
3 Signs Your Sales Forecast Is Already Broken
- 1It takes more than one day to produce a forecast number each weekIf Sales Ops needs to consolidate spreadsheets before a Sales Director can see the pipeline,the Forecast is a retrospective report – not a real-time tool. Every decision lags 3 to 5 days behind reality.
- 2Best Case deals have had no activity in 14 daysA deal that has gone silent for two weeks is usually no longer a Best Case – but if no one updates it,it continues inflating the Forecast number. In long B2B cycles,one month without updates means the Forecast no longer reflects what is actually happening.
- 3Pipeline Coverage is below 2x and no one notices until mid-quarterIf remaining quota is $5M and the pipeline holds only $8M (1.6x),closing every Best Case deal still leaves a shortfall. Knowing this in month one of a quarter is a completely different situation from discovering it in the final week.
Forecast Self-Assessment – 5 Questions to Answer Right Now
No new tool required to answer these five questions. But if any answer is “no” or “I would have to ask someone” – that gap is costing the business real money.
- 1What is the team’s total Commit number right now?
If the answer requires messaging a rep, Forecast is not working correctly. This number should be visible to the Sales Director at any moment without asking anyone.Benchmark: A Sales Director reads the team’s Commit in under 30 seconds without opening a spreadsheet. - 2What is the current Pipeline Coverage against remaining quota?Below 2x means more deals need to enter the funnel immediately. Above 3x means there is enough buffer to absorb slippage without missing quota.
Formula:Pipeline Coverage=Total Pipeline / (Quota – Achieved)
- 3Which Best Case deals have had no activity in the last 14 days?A deal silent for two weeks has likely changed state – but the CRM has not caught up. These are dead deals inflating the Forecast.
Action:Review and move or escalate every Best Case deal with no activity in 14 or more days.
- 4Has each rep’s Sales Quota been entered into the system?
If quota still lives in a manager’s email,the Forecast page cannot show Gap to Quota by org chart – and no one can see who is falling behind.In OplaCRM:Quota is set in the Sales Quota module and syncs automatically to the Forecast page. - 5Can the CEO view Forecast in real time,or does it require waiting for a report?If waiting is required,every important decision is delayed by 5 to 7 days. The number reaching the CEO is already outdated by the time it is read.
In OplaCRM:The CEO opens the Dashboard and sees the Forecast widget immediately. The Forecast page shows the full org chart by fiscal year.
Frequently Asked Questions
See OplaCRM Forecast with your team’s actual pipeline
No fixed demo script. Just a conversation about how your sales team operates and whether what we do actually solves the problem you are facing.
Related Articles
Pipeline Management What Is Win Probability? How to Calculate Deal Win Rate in B2B Sales
Customer Health What is Account Health Score? B2B Customer Health Measurement Guide
CRM Implementation 6 Reasons Why CRM Implementations Fail and How to Avoid Them
Platform Overview What is OplaCRM? The B2B CRM Built for Sales Teams That Actually Sell