

 Tiếng Việt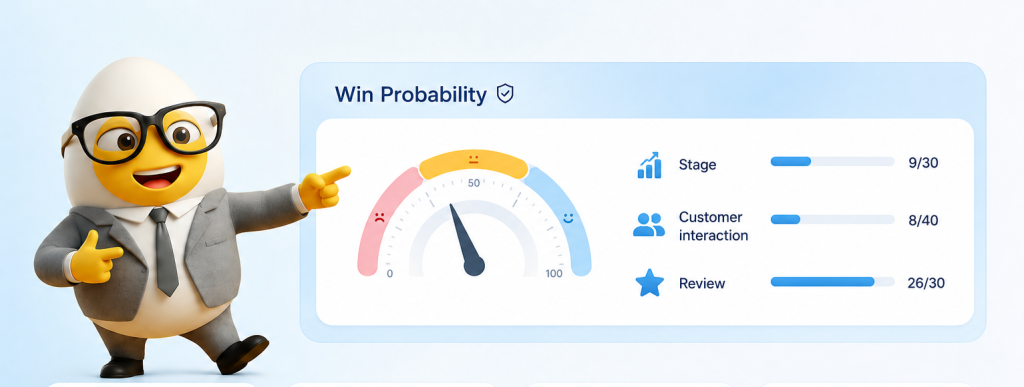
Win Probability is a metric that measures the likelihood of a B2B sales opportunity closing successfully, calculated automatically and continuously from real behavioral data. The concept is widely used in major international CRM platforms such as Salesforce, HubSpot and Pipedrive, where it serves as a core tool for prioritizing resources and improving B2B sales forecast accuracy.
In OplaCRM, Win Probability is calculated automatically from 3 factors: opportunity stage (30 points), customer interaction quality (40 points) and BANT assessment (30 points). Results are displayed visually through 3 color levels: Red (below 33 – low likelihood), Yellow (33-67 – medium likelihood), Green (above 67 – high likelihood).
★ Key Takeaways
- Win Probability is a deal-closing forecast metric, calculated automatically from real data – replacing subjective intuition in pipeline reviews and Sales Forecasting.
- OplaCRM calculates across 3 factors: Stage (30 points) + Customer Interactions (40 points) + Opportunity Review/BANT (30 points) = 100 points total.
- The highest-weighted factor is customer interactions (40 points) – and within that, interactions with Decision Makers through high-quality channels (meetings, demos) score significantly higher than emails or simple messages.
- BANT (Budget – Authority – Need – Timeline) is an evaluation framework that quantifies factors previously only assessed by “gut feeling” – and is the most commonly skipped element in real-world pipeline reviews.
- Two deals with the same Stage and the same number of activities can still have different Win Probability scores if the quality of interactions and the roles of the people interacted with differ – this is what standard activity-counting systems miss entirely.
◷ In this article
- Why B2B Sales Forecasts Are Inaccurate – The Real Reason
- What Is Win Probability? Definition and How It Works
- 3 Common Misconceptions About Win Probability That Make Your Pipeline Meaningless
- How Win Probability Is Calculated in CRM: 3 Deciding Factors
- What Is BANT? Why It Is the Foundation of B2B Opportunity Assessment
- How to Read Win Probability: An Action Playbook for Sales Managers
- How to Increase Your B2B Deal Win Rate – 3 Actions With Immediate Impact
- Win Probability and Sales Forecast: The Formula for Accurate Revenue Prediction
- Frequently Asked Questions
1. Why B2B Sales Forecasts Are Inaccurate – The Real Reason
There is a familiar scenario at most B2B companies: the Sales Manager compiles the monthly forecast, submits a confident report to the CEO, and then by end of quarter, the actual number misses by 30 to 60%.
The question to ask is not “are our Sales reps capable?” but rather “how are we assessing opportunities?”
Most traditional B2B sales forecasts rely on only two sources of information. The first is pipeline stage – where the deal sits in the process, assigned a fixed probability per step (e.g., “Proposal = 60%”, “Negotiation = 80%”). The second is Sales rep sentiment – “the customer seems interested”, “I have a feeling we’ll close next week”. Both approaches are missing one fundamental element: data about what is actually happening in the customer relationship.
Here is the specific problem. A deal in “Negotiation” since 3 months ago – according to traditional pipeline logic, it automatically gets a high probability. But in reality, the last email with the customer was 6 weeks ago, the decision-maker has not returned the last call, and the Sales rep cannot confirm whether budget has been approved. This deal is dying slowly – but looking at the pipeline, it appears identical to a healthy, progressing deal.
This is why so many B2B Sales Forecasts are inaccurate – not because Sales is underperforming, but because the assessment system is ignoring exactly the signals that matter most. Win Probability was built to read those signals.
2. What Is Win Probability? Definition and How It Works
Win Probability is a metric that measures the likelihood of closing a specific sales opportunity successfully, calculated automatically and continuously from real behavioral data. It does not replace the judgment of the salesperson – it provides data so that judgment can be more accurate.
Unlike assigning fixed probabilities by stage (Proposal = 70%, Negotiation = 85%), Win Probability in OplaCRM is calculated dynamically – it changes every time new data arrives: a Sales rep just met with the Decision Maker, the customer just did not respond to an important email, the Sales Manager just updated the BANT assessment. This means a deal’s Win Probability can increase after a strong meeting, or decline after 2 weeks without meaningful activity.
On OplaCRM, results are displayed as a visual gauge with 3 color levels:
Opportunity has a low likelihood of closing. The deal may be at an early stage, with weak interactions, or BANT reveals several unmet conditions.
Practical meaning: The deal needs a thorough review before investing more resources.
Opportunity has potential but still has many uncertain factors. Moving forward but not enough data to be confident.
Practical meaning: This is the group requiring the most proactive intervention – they can shift to Green or Red depending on actions taken in the next 1-2 weeks.
Opportunity has a high likelihood of closing. Multiple signals are aligned across all 3 data dimensions.
Practical meaning: Focus on removing remaining obstacles (contract approval, budget confirmation, C-level sign-off).
One important point: Win Probability is a predictive metric at the current moment, not a verdict about the future. A Red deal can turn Green next week if Sales acts correctly. A Green deal can fall to Yellow if the customer changes their Decision Maker. That is what makes Win Probability useful – not because it gives you answers, but because it continuously asks the right questions.
3. 3 Common Misconceptions About Win Probability That Make Your Pipeline Meaningless
Win Probability only creates value when used correctly. Below are the 3 most common misconceptions that lead to the system being misused – and losing all its meaning:
Misconception 1: High Win Probability means the deal is guaranteed to close
A Win Probability of 80 points does not mean the deal will close 80% of the time in a statistical sense. It means based on current available data, this is the assessed level of feasibility. When context changes – the customer replaces their Decision Maker, a competitor enters with a surprise offer, budget gets cut due to an internal decision – Win Probability needs to be reviewed, not used as reassurance that “this deal is fine.”
Misconception 2: Win Probability is a measure of Sales rep performance
This is the most dangerous misconception. When Sales Managers use each rep’s average Win Probability to evaluate their performance, reps will immediately adjust their behavior: logging more activities regardless of substance, marking Outcomes as Positive for ordinary interactions, filling in BANT carelessly just to get the score. Result: the pipeline looks healthy, forecast numbers go up, but actual prediction accuracy will be worse than before. Win Probability is a decision-making tool – not a leaderboard for people.
Misconception 3: Only the total score matters, no need to look at individual components
The total Win Probability score conceals more information than it reveals, if you do not look at each factor individually. A deal at 55 points could be: Stage 30/30 (maximum) + Interaction 10/40 (very low) + BANT 15/30 (medium) – meaning the deal is in a late stage but the customer has nearly disappeared. Or it could be: Stage 10/30 (early) + Interaction 35/40 (very strong) + BANT 10/30 (low) – meaning a new deal with a highly engaged customer who has not yet been properly assessed. Two completely different situations requiring different actions – but the total score looks the same.
“The most valuable thing about Win Probability is not the total score – it is that every week it forces you to look at each deal and ask: what is pulling the score down, and what can I do about it?” – OplaCRM
4. How Win Probability Is Calculated in CRM: 3 Deciding Factors
OplaCRM calculates Win Probability automatically from 3 factors, totaling 100 points. Each factor measures a different dimension of the deal:
Automatic based on the deal’s position in the sales process – the later the stage, the higher the score
Quality and frequency of interactions, weighted by channel and the role of the person being engaged
Sales rates 4 BANT criteria using stars, plus a qualitative analysis section
Factor 1: Opportunity Stage – 30 points
This is the only fully objective and automatic factor. The later the stage in the sales process (Prospect – Meeting – Solution Proposal – Negotiation – Won/Lost), the higher the Stage score. The logic is simple: if the customer has not dropped out after multiple rounds of the sales process and is nearing close, the probability of reaching the finish line is higher.
However, Stage only tells you where the deal is – not whether it is actually moving or standing still. This is the critical weakness of forecast approaches that rely only on Stage: a deal stuck in “Negotiation” for 4 months still scores as high as one that entered that stage just last week. Win Probability addresses this weakness by combining Stage with the 2 remaining factors.
Factor 2: Customer Interactions – 40 points
This is the highest-weighted factor (40 points) and where OplaCRM differentiates most from simpler CRM systems. The system does not count the number of activities – it evaluates across 3 dimensions:
First: the role of the person being engaged. Interacting with the Decision Maker (the final contract signatory) scores highest. Interacting with the Approver (budget authorizer) scores high. Interacting with an Influencer scores medium. Interacting with a User (end-user) scores lower. This principle reflects B2B reality: the people who sign contracts and approve budgets are the ones who decide whether a deal wins or loses – not end-users, however engaged they may be.
Second: the interaction channel. In-person meetings or demos score highest because they require a time commitment from the customer and allow objections to be handled in real time. Phone calls score high. Emails exchanging substantive content score medium. Chat messages or routine emails score lower. A 1-hour demo with a C-level executive impacts the score more than 15 back-and-forth emails.
Third: the contact’s Health Score. This is the connection point between Account Health Score and Win Probability. If an important contact (for example, the budget approver) has a low Health Score – meaning the relationship is cooling – Win Probability for the entire deal is pulled down even when Stage looks strong. Reason: a low Health Score from a key decision-maker is the earliest signal that a deal is in trouble, before any Stage change occurs.
Combining these 3 dimensions creates an important characteristic: two deals with the same Stage and the same number of activities can still have different Win Probability scores if one is primarily engaging with Users while the other is working directly with the Decision Maker.
Factor 3: BANT Assessment (Opportunity Review) – 30 points
This is the only factor that requires manual input. When the Sales Manager or Sales rep opens the “Add Review” form, the system requires rating 4 BANT criteria from 1 to 5 stars. The total of these 4 criteria contributes 30/100 points to Win Probability.
Beyond the 4 BANT criteria, the form includes an “Analysis” field for qualitative notes – specific risks, potential upsell opportunities, information about competitors in contention for the deal, or any insight that cannot be quantified by stars but is important for understanding this opportunity.
The BANT score is typically the most neglected factor in practice – because it takes time and honesty to complete. But this is also the factor that surfaces risks the other two cannot detect: the customer is highly engaged (high Interaction) and the deal is at a late stage (high Stage), but the Budget has not been approved and the person being worked with is not the actual Decision Maker. That deal looks good on the pipeline but carries high risk.
5. What Is BANT? Why It Is the Foundation of B2B Opportunity Assessment
BANT is an opportunity assessment framework developed by IBM in the 1960s – and after more than 60 years, it remains the framework most widely used by B2B Sales teams for a simple reason: it asks exactly the 4 questions that, without answers, a deal cannot close.
Does the customer have budget for this solution? Has it been approved, or is it still pending authorization? Who has the authority to approve it?
Practical question to ask: “Which department’s budget would this investment come from? What does your approval process look like?”
Does the person you are working with actually have the authority to make the purchase decision? Or are they gathering information on behalf of someone else?
Practical question to ask: “Besides yourself, whose approval is needed for this decision?”
Does the customer have a genuine need, or are they just exploring? Is the problem urgent enough for them to prioritize solving it now?
Practical question to ask: “If this problem is not resolved in the next 6 months, what would the impact be on your organization?”
How soon does the customer want to implement? Is there a specific deadline or external pressure driving an earlier decision?
Practical question to ask: “Ideally, when would you want to start the implementation?”
In OplaCRM, BANT is integrated directly into the Opportunity Review with a star-rating form (1-5 stars per criterion). This solves an important practical problem: BANT is typically assessed once at the start of a deal and never updated. When it is part of Win Probability and Win Probability is displayed in real time within the pipeline, Sales Managers have an incentive to update BANT when context changes – the customer just replaced their CFO, budget was cut in a restructuring, or the timeline was pushed to next quarter.
One important note on using BANT correctly: BANT is not a checklist to eliminate deals from the pipeline. A deal with a low BANT score (for example, Budget not yet approved, Timeline still vague) does not mean it is a bad deal – it means the deal needs more nurturing before investing heavy resources. A low BANT score is a signal to ask questions and act with intention, not a reason to walk away.
6. How to Read Win Probability: An Action Playbook for Sales Managers
A Win Probability score only matters when it leads to specific action. The most common problem is that Sales Managers see a Yellow or Red score and do not know what to do next – or they act on reflex (call the customer) instead of analysis (first identify which factor is pulling the score down).
Here is a framework for reading Win Probability in layers:
| Step | Question | Action |
|---|---|---|
| 1. Look at the overall color | Is this deal Red/Yellow/Green? | Determine the level of urgency for intervention |
| 2. Check each factor | Which factor is pulling the score down: Stage, Interaction or BANT? | Direct action toward the specific low-scoring factor |
| 3. Analyze Interactions | Is Interaction low because of insufficient engagement with Users or Decision Makers? | Plan outreach to the right person through the right channel |
| 4. Check BANT | Has BANT been completed? Which criterion scores lowest? | If not completed: complete it now. If Budget is low: verify funding status |
And here is the action playbook by color:
| Color | Score | Priority Action | Owner | Deadline |
|---|---|---|---|---|
| 🔴 Red | Below 33 | Review all 3 factors, identify which is lowest. Decide: continue investing or move to long-term nurture? | Sales Manager | This week |
| 🟡 Yellow – low Stage | 33-67, low Stage | Focus on building the relationship and qualifying BANT. Do not push the deal to the next stage without a concrete reason | Sales rep | Ongoing |
| 🟡 Yellow – high Stage | 33-67, high Stage | This is the group requiring the most urgent intervention. Deal is in a late stage but Interaction or BANT is low – high risk of losing. Schedule a meeting with the Decision Maker immediately | Sales Manager + Sales rep | Within 48 hours |
| 🟢 Green | Above 67 | Maintain momentum. Focus on removing final obstacles: contract review, budget approval, C-level sign-off. Prepare onboarding plan to demonstrate value immediately after closing | Sales rep | Per deal timeline |
Important note in the table above: “Yellow with high Stage” is the most dangerous group and the most commonly overlooked in pipeline reviews. These are deals at a late stage (significant resources already invested), but data signals indicate the relationship is in trouble. Without timely intervention, this group causes the most end-of-quarter surprises.
7. How to Increase Your B2B Deal Win Rate – 3 Actions With Immediate Impact
Since Win Probability is calculated from 3 factors, there are 3 corresponding directions to improve the score. Below is how to execute each direction as specifically and effectively as possible:
Action 1: Meet with the Decision Maker this week (improve Interaction score)
This has the largest impact because Interactions account for 40/100 points and heavily weight high-quality engagement with decision-makers. But not every meeting carries the same value.
A meeting has high impact when: (1) The attendee is the Decision Maker or Approver, not just a User, (2) It has a specific objective – not “checking in” but “answering question X” or “resolving objection Y”, (3) It ends with a clear next step that is logged in the system with an honest Outcome.
After the meeting, the most important step that is most often skipped: log the activity with the real Outcome. If the meeting went well, mark Positive. If the customer still has significant hesitation, mark Neutral. If there were negative signals (customer said “we are also looking at other options”), mark Negative. An honest Outcome is data input for the system – if everything is always Positive, the system will detect the abnormal pattern and reduce the reliability of that data.
Action 2: Complete the BANT assessment today (improve Review score)
If the deal has no Review yet, this is the “easiest points to gain” – but more important than the score is the value of forcing yourself to think through each BANT criterion clearly.
How to fill in BANT with real value, not just for the score: before rating with stars, write 1-2 sentences in the Analysis field for each criterion – “Budget: customer confirmed approximate budget of X, but CFO has not formally approved yet, expected Q3”, “Authority: working with the PM, have not reached the VP Sales who is the final signatory”. These notes not only make the score more accurate but also serve as essential documentation when handing off a deal or when a Sales Manager needs to understand a deal quickly.
Action 3: Advance the deal to the next stage correctly (improve Stage score)
Stage is the easiest factor to “game” – it only takes a click to change. But advancing Stage at the wrong moment does more harm to the pipeline than good. The principle: only advance Stage when the customer has taken a specific action demonstrating their commitment, not when the Sales rep feels “it is time.”
Concrete example: move from “Solution Proposal” to “Negotiation” when the customer has sent back the proposal with specific adjustment requests (not just said “let me think about it”). Move from “Negotiation” to “Contract” when the customer has confirmed key terms in writing (not just said “basically OK” on a call).
8. Win Probability and Sales Forecast: The Formula for Accurate Revenue Prediction
Win Probability and Sales Forecast are two different concepts but closely connected within the B2B pipeline management process. Understanding this relationship correctly is the key to using both effectively.
Win Probability is a deal-level metric – reflecting the likelihood of closing that specific opportunity at the current moment. It changes over time as new data arrives.
Sales Forecast is an aggregated output at the total pipeline level – projecting total revenue to be achieved in a period (month, quarter), based on the Win Probability of all active deals.
In OplaCRM, each deal is classified into one of 4 Forecast groups corresponding to its Win Probability level:
| Forecast Group | Win Probability | Meaning in the forecast | Revenue contribution method |
|---|---|---|---|
| Closed Won | Already closed | Certain revenue – already received | 100% of deal value |
| Commit | Above 67 (Green) | Sales Manager commits to closing this period | Counted at 100% in the realistic scenario |
| Best Case | 33 – 67 (Yellow) | May close if everything goes well | Added to the optimistic scenario |
| Pipeline | Below 33 (Red) | Still in pipeline but not counted this period | Only counted in long-term scenarios |
The power of this classification lies in this: instead of a single forecast number (which is typically wrong), Sales Managers can present to the CEO 3 data-backed scenarios:
- Pessimistic (baseline): Only Closed Won + Commit – near-certain revenue
- Realistic (expected): Closed Won + Commit + 60% of Best Case – the most probable scenario
- Optimistic (best case): All Commit + Best Case comes in – if everything goes well
The practical difference in a CEO meeting: instead of saying “I expect to hit 2 billion this month” (with no one knowing where that number comes from), the Sales Manager can say: “The baseline is 1.4 billion from Commit and Closed Won. The expected scenario is 1.9 billion if these 3 Best Case deals close – their current probability is 45-60%. The best case is 2.3 billion if all Best Case comes in.” This is a data-based conversation, not a faith-based one.
From Intuition to Data: The Most Important Shift in B2B Pipeline Management
Win Probability does not make B2B selling mechanical or remove the human element. It cannot detect an upsell opportunity that only a sharp Sales rep would notice. It cannot know when a customer is dealing with internal problems that only a trusted relationship would reveal. It cannot replace a well-timed call from someone who has built a relationship over many years.
But it does solve the core problem that most B2B Sales teams face: critical information scattered across multiple people, inconsistent assessments between Sales reps, and forecasts that depend on how optimistic each individual happens to feel in a given month.
When Win Probability becomes a natural part of the weekly pipeline review – not to report upward, but for Sales Managers and Sales reps to ask better questions together each week – the Sales team begins developing a deeper ability to read deals. And that is the true long-term value of Win Probability: not a number on a dashboard, but a new way of thinking about the quality of each sales opportunity.
9. Frequently Asked Questions About Win Probability
What is Win Probability?
A metric that measures the likelihood of closing a B2B sales opportunity successfully, calculated automatically based on 3 factors: opportunity stage (30 points), customer interactions (40 points) and BANT assessment (30 points). Classified into 3 levels: Red (below 33), Yellow (33-67), Green (above 67).
Why do 2 deals at the same Stage have different Win Probability scores?
Because the Interaction score is based on quality, not quantity. 3 influencing factors: (1) The role of the person being engaged – Decision Maker scores higher than User, (2) The interaction channel – meetings and demos score higher than email/chat, (3) The contact’s Health Score – a cooling relationship pulls the score down even when Stage looks strong.
What is BANT and why does it matter for Win Probability?
BANT is a B2B opportunity assessment framework with 4 criteria: Budget (has it been approved?), Authority (does the person you are working with have decision-making power?), Need (is the need urgent enough?), and Timeline (is there a specific deadline?). In OplaCRM, Sales rates each criterion with 1-5 stars, contributing a total of 30/100 points to Win Probability – quantifying factors that were previously only assessed by gut feeling.
How does Sales Forecast use Win Probability?
OplaCRM classifies each deal into 4 Forecast groups based on Win Probability: Closed Won (already closed), Commit (Green – near-certain), Best Case (Yellow – possible if things go well), Pipeline (Red – not counted this period). From there, Sales Managers have 3 forecast scenarios: pessimistic (Commit only), realistic (Commit + a portion of Best Case) and optimistic (everything).
What is the fastest way to increase Win Probability?
3 actions in order of impact from highest to lowest: (1) Schedule a meeting with the Decision Maker this week and log the Outcome honestly afterward – highest impact because Interactions account for 40 points and Decision Maker carries the highest weight, (2) Complete the BANT assessment if not done yet – 30 “easy points” with high diagnostic value, (3) Advance the deal to the next Stage if the customer has taken a specific commitment action.
Is Win Probability 100% accurate?
No, and it cannot be. Win Probability is a predictive metric based on currently available data – it is much better than subjective intuition, but it cannot account for unexpected variables such as personnel changes on the customer side, internal budget cuts, or a competitor appearing with an exceptional offer. Its value lies in continuously asking the right questions – not in providing absolute answers.
Should Win Probability be used to evaluate Sales rep performance?
No. When Win Probability becomes a personal KPI, Sales reps will optimize for the score rather than actual deal quality: logging hollow activities, marking Outcomes as optimistic, and filling in BANT carelessly. Win Probability is a decision-making tool for individual deals – not a measure of individual performance.
See Win Probability running with your team’s real data
No sales pressure – just a conversation about how your pipeline is actually performing.